This post will briefly introduce the concepts of consumer and producer surplus, dead weight loss, and allocative efficiency, as well as examining their relationship with elasticity, global trade, and price discrimination.
Consider a market for a good - donuts, say. Suppose there are (for the sake of simplicity) three people who are willing to buy donuts: Alice, Bob, and Chad. Alice would be willing to buy a donut for at most $5$ dollars, Bob would be willing to buy one for at most $4$ dollars, and Chad would buy one for at most $2$ dollars; Alice would be willing to buy a second donut for at most $4$ dollars, Bob would be willing to buy a second donut for at most $2$ dollars, and Chad would be willing to buy a second donut for at most $1$ dollar; and so on. More succinctly, here is a demand schedule for donuts for Alice, Bob, and Chad:
Now suppose, for example, that the price of a donut is currently $3.5$. Then Alice will buy $2$ donuts and Bob will buy $1$ donut. Notice that Alice will pay only $7$ dollars for two donuts, but would have been willing to pay $5+4=9$ dollars, meaning that she has essentially gained $2$ dollars of utility. In other words, Alice’s surplus is $2$ dollars. Similarly, Bob only has to pay $3.5$ dollars whereas he would have been willing to pay $4$ dollars, meaning that his surplus is $0.5$ dollars. The total consumer surplus is the sum of the surpluses of each consumer as a result of their purchases of a particular good - in this case, it would be $2+0.5=2.5$ dollars. If the price of donuts miraculously dropped to $1.5$ dollars, then Alice would again buy $2$ donuts with a surplus of $9-3=6$, Bob would buy $2$ donuts with a surplus of $6-3=3$, and Chad would buy $1$ donut with a surplus of $2-1.5=0.5$, making a total consumer surplus of $6+3+0.5=9.5$.
But we’ve been assuming that these donuts are available in unlimited quantities, but someone has to bake them. The firms that manufacture and sell donuts also incur costs when producing donuts, and the difference for each firm between the price at which their donuts are sold and the cost of manufacturing each donut is equal to that firm’s surplus. Overall, the sum of surpluses of all donut firms is equal to the producer surplus. In the above example, if the price is set too low (like at $1.5$ dollars), many people may demand donuts, but few firms may be able to afford to produce donuts at a profit, causing a shortage and reducing surplus. If the price is too high, lots of firms will produce donuts, but few people will buy them, and we will have a surplus (not to be confused with producer/consumer surplus), which also reduces surplus. How can overall surplus be maximized?
Let’s have a look at this situation on a supply and demand graph. The differences between the maximum prices consumers would have paid for a good and the actual price charged is equal to the consumer surplus, and in the context of a supply and demand graph, this can be interpreted at the vertical distance between a demand curve and the straight horizontal line representing the price. Summing all of these distances gives us an area on the supply and demand graph:
Thus, the consumer surplus is equal to the shaded area. Similarly, the producer surplus is the sum of the differences between the price at which each good is sold and the prices at which each firm could have afforded to sell them, giving us the area between the horizontal price line and the supply curve up to the quantity produced and consumed:
The producer surplus is equal to the shaded area in this graph. Notice that the total surplus, or the sum of producer and consumer surplus, is maximized when the price is equal to the market’s equilibrium price:
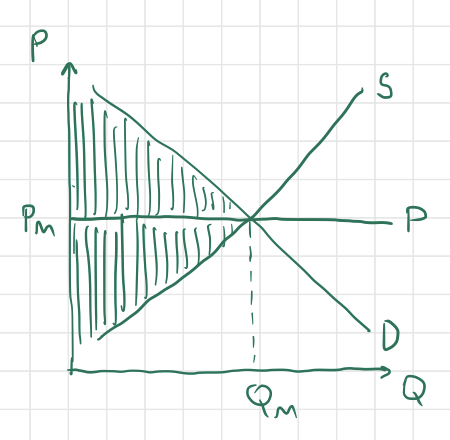
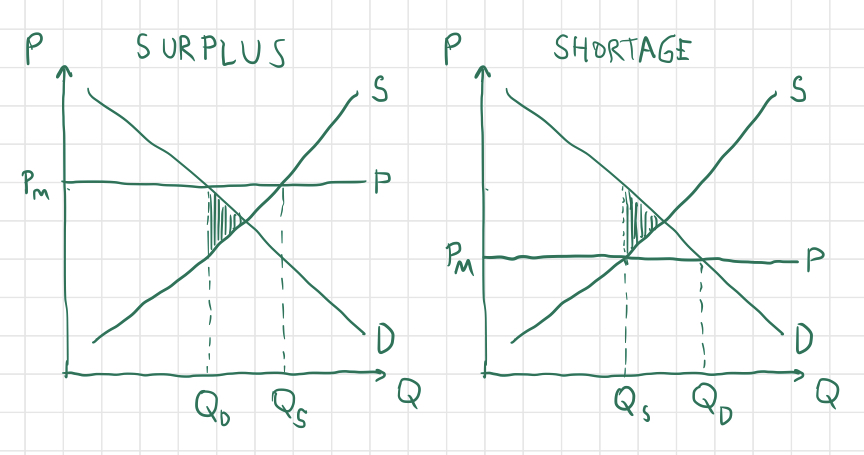
The total surplus in the graph above is shaded. Since total surplus is maximized in this configuration, we say that the market is experiencing allocative efficiency. We know that the total surplus is maximized at this price because if the price is any greater or less than the equilibrium price, the area representing total surplus will decrease, and a triangular piece will be “shaved off.” The decrease in total surplus that results from a price set either too high or too low is called the dead weight loss, and is represented by a shaded triangle in each of the graphs below.
As explained in my post regarding supply and demand, the market will naturally tend towards the equilibrium price and quantity at which surplus is maximized and allocative efficiency is achieved.
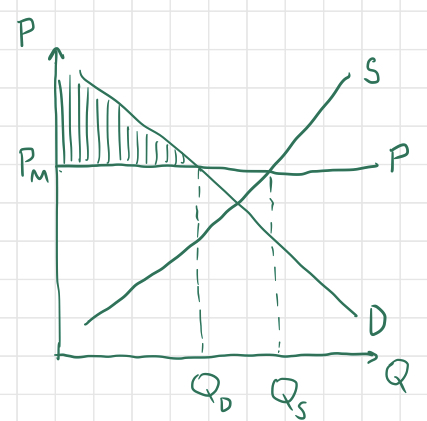
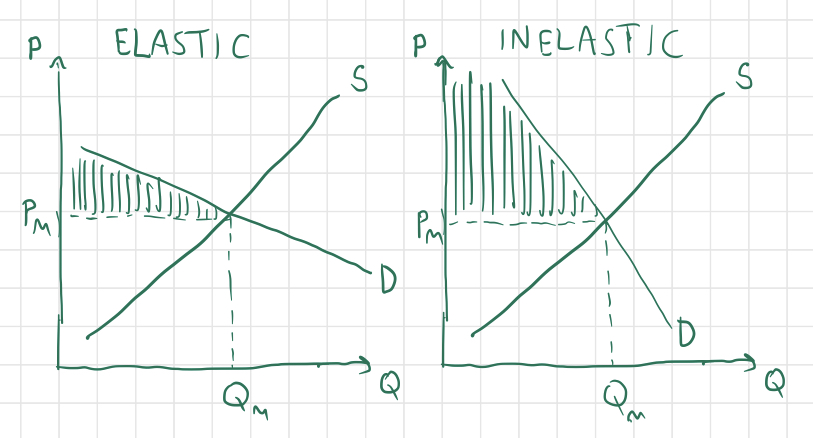
The elasticity of demand and supply both affect the magnitude of consumer and producer surplus. We can see by constructing graphs with varying elasticity of demand that the more elastic the demand curve is, the smaller the proportion of consumer surplus will be:
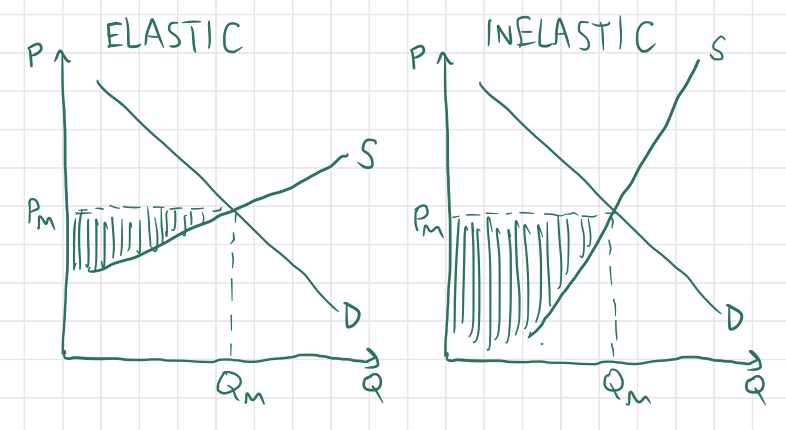
Similarly, the more elastic the supply is, the smaller the proportion of producer surplus will be:
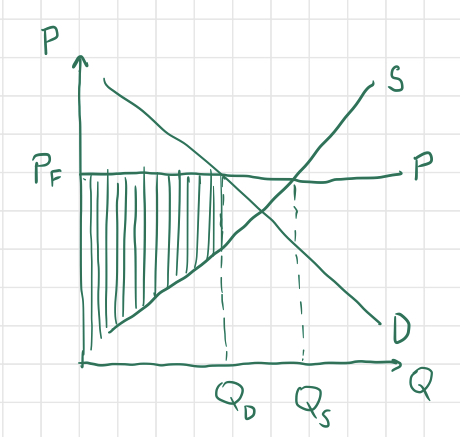
Now let’s consider the implications for producer and consumer surplus when there exist conflicts between the global and domestic markets for a good. Suppose, for instance, that a good’s world price is lower than the allocatively efficient domestic price of that good:
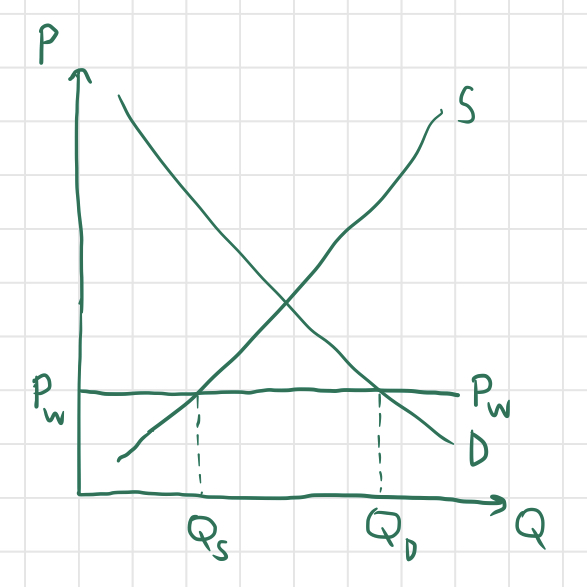
Note that in this case, the quantity $Q_D$ of the good demanded by consumers within the country is greater than the quantity $Q_S$ produced by domestic suppliers. However, this difference will not necessarily cause the supply and demand curves to shift as they did in the previous post. There may not actually be a shortage, since the country can import the difference $Q_D-Q_S$ from foreign suppliers.
What does this do to surplus? Have a look at this graph:
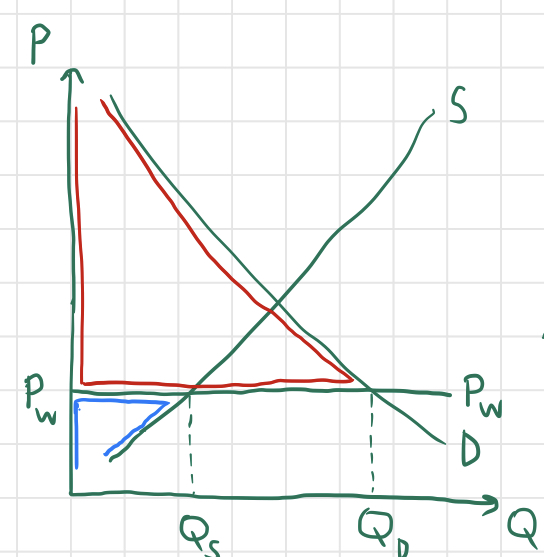
In this situation, the consumer surplus (red) is enormous, while the producer surplus (blue) has been decimated by competition with foreign firms. In fact, the total surplus of this country actually exceeds the surplus that it could achieve by closing itself to trade, since the huge gain in consumer surplus more than compensates for the loss of producer surplus. However, if a country’s producers are suffering from foreign competition, the country might try to lend a helping hand by imposing a tariff on foreign goods, artificially raising the domestic price. Look at what this does to surplus:
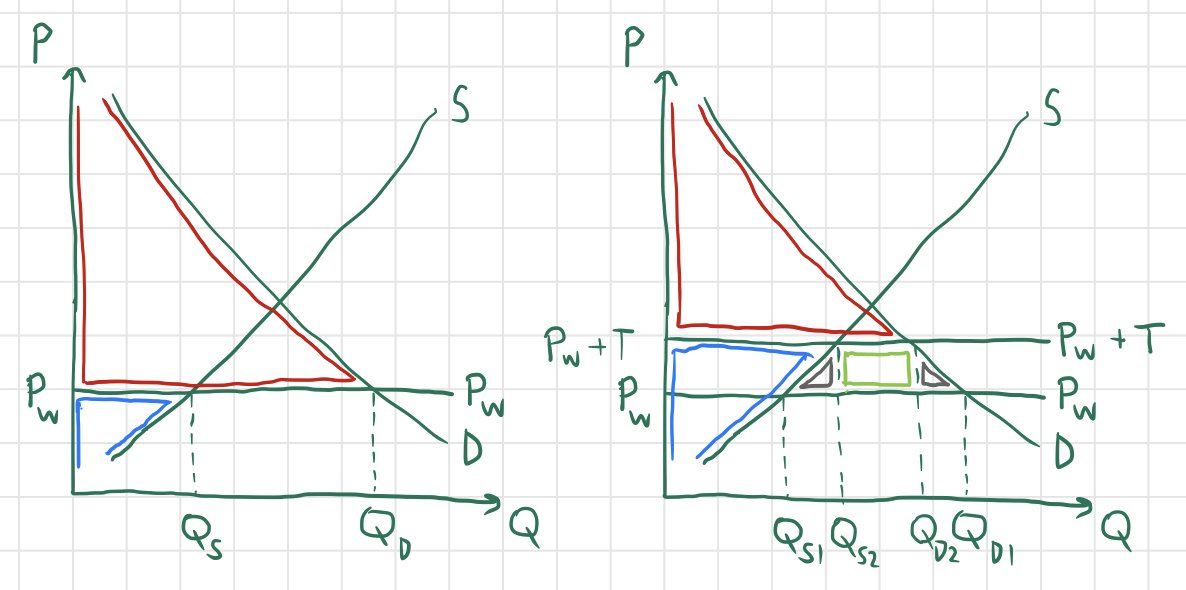
Again, the area outlined in red represents consumer surplus and the area outlined in blue represents producer surplus, while the area outlined in light green represents the amount of tariff money collected by the government. Notice that the quantity imported has decreased, since $Q_{D2}-Q_{S2}\lt Q_{D1}-Q_{S1}$. Although this tariff helps domestic producers, it actually results in a loss of efficiency; compared to the previous graph, the area representing total surplus (consumer surplus plus producer surplus plus tariff revenue) has lost two “chunks” of area (represented by the two triangles outlined in gray).
Let’s looks at one more phenomenon that affects consumer and producer surplus: price discrimination. In the previous examples, we have assumed that all consumers purchasing a good are charged the same price for a good, but in the real world, this is often not the case. For instance, people buying airline tickets on short notice are often charged higher prices (since businessmen typically buy tickets on short notice, and businessmen can afford to pay more for plane tickets than other people). Price discrimination can also lower prices for groups of consumers, like when firms near a college campus offer discounts for college students (who they know are already probably short on cash).
In a typical supply and demand graph, the line representing price is horizontal, since each unit of the good is sold at a constant price:
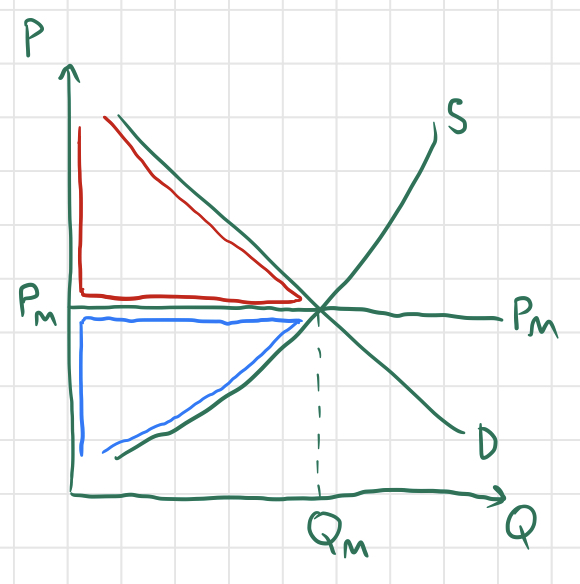
But when price discrimination occurs, the “price curve” can vary with quantity:
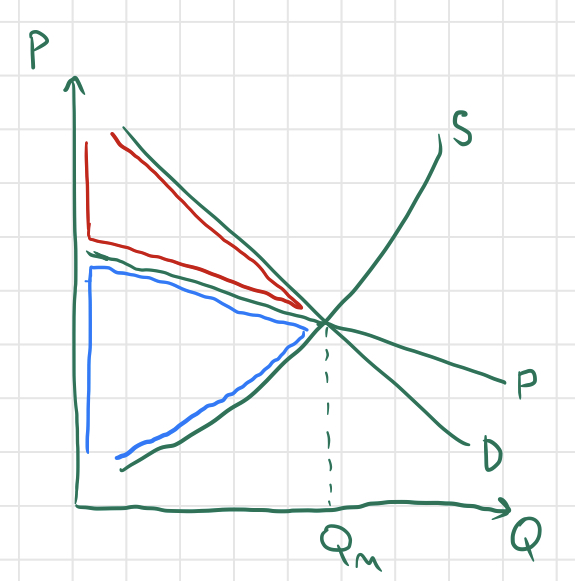
Notice that in this scenario, price discrimination has not caused any instability in the market; it has caused neither a surplus nor a shortage, since the intersections of the price curve with the supply and demand curves occur at the same point. Accordingly, none of the total surplus has been lost, and the market is still operating at allocative efficiency. All that has changed is the proportions of consumer and producer surplus making up total surplus - the producers have “stolen” a chunk of the consumer surplus.
That concludes this blog post! There are various other interesting scenarios whose effects on surplus are interesting to analyze. For example, try considering a country in which the domestic equilibrium price is less than the world price, and figuring out the implications on that country’s surplus and any actions the government might take to alleviate a burden on consumer or producer surplus.